From observations to the final image
Please click on the pictures to see larger versions.
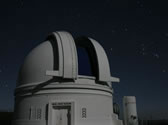 The data used to create the image were obtained at the
Samuel Oschin Telescope at Palomar Observatory,
as a part of the
Palomar-Quest (PQ) digital sky survey.
The survey is a collaboration between the groups led by Prof. Charles Baltay from Yale University's Physics Department,
and by Prof. S. George Djorgovski
from
Caltech's Astronomy Department. The data used to create the image were obtained at the
Samuel Oschin Telescope at Palomar Observatory,
as a part of the
Palomar-Quest (PQ) digital sky survey.
The survey is a collaboration between the groups led by Prof. Charles Baltay from Yale University's Physics Department,
and by Prof. S. George Djorgovski
from
Caltech's Astronomy Department.
A special camera was built for this purpose by Prof. Baltay's group, in collaboration with other physicists from the Indiana University.
The camera has 112 Charge-Coupled Device (CCD) grouped in 4 rows, which can be covered with 4 different filters.
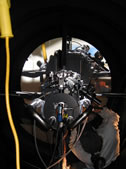 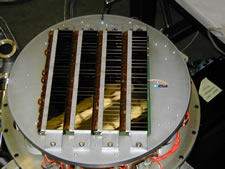 
CCDs are the standard detectors used for optical (and some ultraviolet and x-ray) astronomy, and are also commonly used in all consumer digital cameras today. There are about 162 million pixels in the PQ camera.
Approximately half the time of the telescope is used for the PQ survey, while the rest is used by the JPL NEAT team to search for potentially hazardous asteroids,
and by the
Caltech Professor Mike Brown,
and his collaborators, who are continuing to discover dwarf planets in the outer regions of the Solar system.
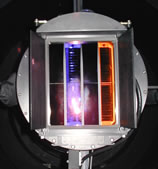
In the PQ survey, the data are taken in the so-called drift scan mode, as illustrated below:
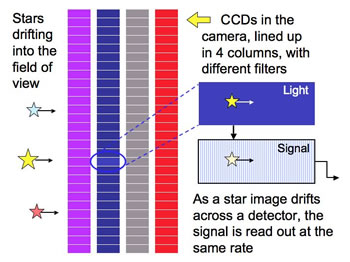
The telescope is pointed at a predetermined location on the sky, and left there, not tracking the apparent rotation of the celestial sphere (this is very unlike the standard way of astronomical observing, where the telescope tracks the sky as exactly as possible). As the sky rotates, images of stars, galaxies, etc., drift across the detectors. But instead of taking smeared snapshots, we read out the detectors at exactly the same rate as the sky images drift across, so that in the end we have long, continuous image strips, one from each of the CCDs.
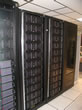 These images are then transferred using fast network links to Yale, Caltech, and other locations as needed, and processed. At Caltech, the processing is done at the Center for Advanced Computing Research (CACR).
Some of the equipment used includes a Beowulf-type computer ,
fast networks, and other devices, some of which came from the U.S.
Teragrid project.
But the essential part is the software used to process the data. These images are then transferred using fast network links to Yale, Caltech, and other locations as needed, and processed. At Caltech, the processing is done at the Center for Advanced Computing Research (CACR).
Some of the equipment used includes a Beowulf-type computer ,
fast networks, and other devices, some of which came from the U.S.
Teragrid project.
But the essential part is the software used to process the data.
The data processing consists of an elaborate sequence of removals of various instrumental artifacts (a common thing when one uses cutting-edge scientific measuring devices) and calibrations. The set of programs used to accomplish this is called the Data Reduction Pipeline. There are actually several such pipelines, each optimized for different scientific goals. This results in millions of individual image frames where the intensity is proportional to the amount of light in a consistent fashion, taken through several different filters. You can think of them as mosaic tiles, which need to be assembled into a larger picture, except that the tiles overlap, and correspond to different filters (e.g., for the Red, Green, and Blue layers of the color image). This mosaic-making process is done using special image compositing software developed for the Virtual Observatory.
Cleaned, calibrated, and composited images are then used for a variety of scientific studies.
For the "Big Picture", we used data taken in the astronomical I, R, and B filters to generate an RGB color composite tiff image, with the color balance chosen to be indicative of the physical colors of objects in the sky.
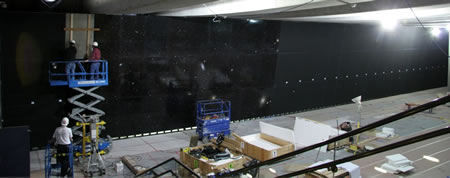
In the case of the "Big Picture", the entire image was then subdivided into 114 "tiles", corresponding to the individual image panels used for the physical manufacturing. Each of them was then cosmetically cleaned "by hand" from the remaining glitches and artifacts which were not removed by the automated processing. These image tiles were then reproduced on the steel-backed porcelain enamel panels (each 4 ft wide and 6 and 2/3 ft tall) by the Winsor Fireform company.
The panels were then installed in the Gunther Depths of Space exhibit hall at the Griffith Observatory, where you can see them in person.
How the Big Picture was made, an article
in the Caltech's Engineering & Science magazine, vol. 69, No. 4, p. 20
(Dec. 2006). |